This story was updated at 11:30am on April 29, 2020.
After more than a month in a nationwide lockdown—and with some states coming up on their two-month mark—America’s COVID-19 pandemic seems to be holding steady. States like New York that were hit hard early continue to suffer the nation’s heaviest death toll, while other states that were expected to see high casualty rates have not experienced a dramatic spike in mortality.
In other words: The hot spots remain hot, but stay-at-home orders seem to be preventing a New York-style overwhelm in other states.
The latest IHME model predicts 74,073 COVID-19 fatalities nationwide, but only if we social distance through May.
According to the University of Washington’s Institute for Health Metrics and Evaluation (IHME), the global go-to source for reliable modeling of the COVID-19 virus’ path, New York’s coronavirus hospitalizations aren’t growing—but neither are they declining with any rapidity. The IHME model now predicts 24,088 deaths caused by the SARS-CoV-2 virus in New York State by June 1, 2020. As of Wednesday, April 29, state officials had reported 17,968 actual deaths.
Nationwide, the IHME model increased total expected US mortality in the COVID-19 pandemic’s first wave to 74,073 on April 27—an increase of nearly 7,000 from the previous week’s estimate. According to the Johns Hopkins Coronavirus Resource Center, 56,259 actual COVID-19 deaths have already been recorded in the United States—more Americans than were killed in the Vietnam War.
It’s helpful to keep in mind that the IHME projections are just that—projections. They’re based on the best available data at a certain point in time. The projections themselves may influence leaders to make policy decisions, and individuals to make choices, that alter the actual outcome.
“All models are just models,” Dr. Anthony Fauci has said. “When you get new data, you change them.”
Order cannabis online and receive it curbside with Leafly Pickup
Social distancing through May?
The national mortality estimate also assumes that full social distancing measures will remain in place nationwide throughthe end of May. That may come as a bit of a shock to many Americans who currently expect the nation’s radical shutdown to ease at the end of April.
In the West Coast states that saw the earliest outbreaks—California, Washington, and Oregon—quick action by state government leaders and early shutdown orders seem to be working. On April 1, the IHME model predicted 1,545 total COVID-19 deaths in Washington state by June 1. But only five days later, on April 6, the same model reduced that mortality estimate to 977. That’s a savings, in theory, of 568 lives. By April 21, the Washington state total mortality estimate had been reduced even further, to 779.
Keeping the curve under the line
The phrase flattening the curve means taking measures to make sure the number of hospitalized patients (the bell curve) remains below the graph line representing the number of available hospital beds. (It can also be a measure of ICU beds, or ventilators.) The importance of flattening the curve is illustrated by New York State, which is suffering such tragically high mortality because the number of patients is overwhelming the state’s medical capacity, as shown in this IHME graph of patients plotted against available beds:
Shop highly rated dispensaries near you
Showing you dispensaries nearNew York State: COVID-19 patients and hospital bed capacity

New York’s patient count (the dash line) broke through the state’s 13,000 bed capacity in late March. (Chart via IHME, University of Washington)
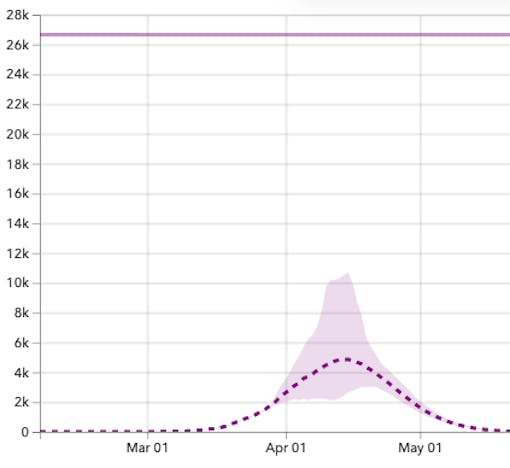
In California, Gov. Gavin Newsom instituted the nation’s first statewide stay-at-home order on March 19. That has helped keep the state’s COVID-19 outbreak from overwhelming the state’s hospital bed capacity of 26,000.
California: COVID-19 patients and hospital bed capacity

California’s patient count remains relatively low, and doesn’t even approach the state’s 26,600 bed capacity. (Chart via IHME, University of Washington)
Governors leading where the White House won’t
With the federal government doing little to prepare or respond to the pandemic, state leaders have had to step up and lead. States where that happened early—like California and Ohio—are seeing positive results. Both states experienced early and dramatic shutdowns and stay-at-home orders, put in place by their governors. The IHME model now lists them among the states with the lowest projected per-capita mortality rate, around five to seven deaths per 100,000 residents.
By contrast, Georgia, whose governor delayed the implementation of stay-at-home orders, are now projected to suffer more than 23 deaths per 100,000 residents.
In the Northeast, the virus arrived too early and the stay-at-home orders came too late. New York, Connecticut, New Jersey, Massachusetts, and Rhode Island are expected to suffer among the worst casualty rates, according to the IHME model.
To put that in perspective: New York has half the population of California, but is projected to record 12 times the number of COVID-19 mortalities as the Golden State.
The IHME site is updated every three days, and is always worth checking out here. In the meantime, we’ve gathered a simplified table, below, with the IHME data as of April 27, 2020.
| State | Apex of COVID-19 cases (April 21 projection) | Total deaths by June 1 (April 1 projection) | Total deaths by June 1 (April 21 projection) | Total deaths per 100,000 residents (April 1 projection) | Total deaths per 100,000 residents (April 21 projection) |
|---|---|---|---|---|---|
| Alabama | April 22 | 1,137 | 290 | 23.2 | 5.9 |
| Alaska | April 22 | 145 | 17 | 19.7 | 2.4 |
| Arizona | April 22 | 1,569 | 480 | 21.5 | 6.6 |
| Arkansas | April 28 | 729 | 131 | 24.3 | 4.4 |
| California | April 13 | 4,997 | 1,743 | 12.6 | 4.4 |
| Colorado | April 11 | 1,683 | 649 | 29.5 | 11.4 |
| Connecticut | April 21 | 414 | 2,884 | 11.5 | 80.1 |
| Delaware | April 21 | 236 | 136 | 24.4 | 13.6 |
| District of Columbia | April 21 | 384 | 213 | 54.9 | 30.4 |
| Florida | April 12 | 5,308 | 1,537 | 24.7 | 7.1 |
| Georgia | April 21 | 2,639 | 1,981 | 24.9 | 18.7 |
| Hawaii | April 22 | 351 | 26 | 24.7 | 1.9 |
| Idaho | April 10 | 442 | 61 | 25.3 | 3.4 |
| Illinois | April 13 | 2,326 | 2,093 | 18.3 | 16.5 |
| Indiana | April 22 | 906 | 931 | 13.5 | 13.9 |
| Iowa | May 5 | 759 | 442 | 23.7 | 14.2 |
| Kansas | April 20 | 684 | 273 | 23.6 | 9.4 |
| Kentucky | April 24 | 936 | 466 | 20.8 | 10.4 |
| Louisiana | April 13 | 1,978 | 1,704 | 42.4 | 37.0 |
| Maine | April 16 | 360 | 53 | 26.9 | 4.1 |
| Maryland | April 19 | 1,679 | 1,112 | 15.2 | 18.5 |
| Massachusetts | April 19 | 1,507 | 3,898 | 21.8 | 56.5 |
| Michigan | April 12 | 3,007 | 3,361 | 30.1 | 33.6 |
| Minnesota | April 18 | 1,039 | 301 | 3.5 | 5.4 |
| Mississippi | April 24 | 1,223 | 399 | 40.8 | 13.3 |
| Missouri | April 12 | 1,193 | 385 | 5.9 | 6.3 |
| Montana | March 30 | 258 | 14 | 25.8 | 1.3 |
| Nebraska | May 9 | 413 | 245 | 21.4 | 12.9 |
| Nevada | April 7 | 506 | 240 | 16.9 | 7.7 |
| New Hampshire | April 21 | 329 | 70 | 24.3 | 5.4 |
| New Jersey | April 14 | 1,844 | 7,116 | 20.7 | 80.0 |
| New Mexico | April 18 | 493 | 105 | 23.5 | 5.0 |
| New York | April 9 | 15,788 | 23,741 | 81.0 | 121.7 |
| North Carolina | April 15 | 2,446 | 310 | 23.3 | 3.0 |
| North Dakota | May 12 | 158 | 277 | 20.8 | 34.6 |
| Ohio | April 15 | 1,671 | 771 | 14.3 | 6.6 |
| Oklahoma | April 22 | 1,100 | 306 | 27.5 | 7.8 |
| Oregon | April 12 | 513 | 120 | 12.2 | 2.8 |
| Pennsylvania | April 18 | 1,574 | 2,323 | 12.3 | 18.1 |
| Rhode Island | April 25 | 254 | 578 | 24.0 | 57.8 |
| South Carolina | April 10 | 1,028 | 217 | 20.1 | 4.2 |
| South Dakota | May 12 | 191 | 98 | 21.6 | 10.9 |
| Tennessee | April 4 | 4,984 | 235 | 73.3 | 3.5 |
| Texas | April 22 | 5,768 | 1,166 | 19.9 | 4.0 |
| Utah | April 28 | 550 | 223 | 17.4 | 7.0 |
| Vermont | April 13 | 69 | 43 | 11.0 | 7.2 |
| Virginia | April 23 | 1,114 | 771 | 13.1 | 9.1 |
| Washington | April 5 | 1,545 | 779 | 20.3 | 10.25 |
| West Virginia | April 17 | 466 | 35 | 25.9 | 1.9 |
| Wisconsin | April 11 | 926 | 340 | 16.0 | 5.9 |
| Wyoming | April 30 | 134 | 243 | 22.3 | 40.5 |


